vortices
I seem to spend a lot of my spare time playing with cellular automata. Here's a simple model of gases:
image:
video:
Squares move around on a grid, bouncing off each other and the walls.
The amazing thing about this model is this: run it on a bigger grid and you get an accurate simulation of flow patterns. And that means turbulence and swirling eddies and wisps of smoke and things like that:
image:
video:
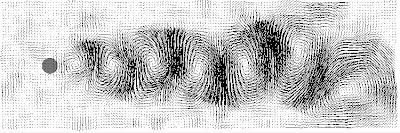
All we've done is run it on a larger grid (3000x1000) and to show the direction of the local flow with lines. We make the fluid flow from left to right by simply overwriting the left-hand column with particles moving to the right. An obstacle disrupts the flow, shedding eddies in its wake.
The question asks itself: Why does this work? Why does such a simple model of bouncing particles yield a good model of flow? The key is that the particles conserve momentum: they keep moving until they collide, and the particles after a collision have the same total momentum as the particles before the collision. And so over a larger area you get two things happening: a) the fluid will tend to move into areas of lower pressure (particles get bounced out of higher density areas), and b) if an area of fluid has an overall momentum it will get carried forward, pushing against whatever it encounters. It's a delightful system and makes pretty pictures.
Further reading:
Notes:
image:
video:
Squares move around on a grid, bouncing off each other and the walls.
The amazing thing about this model is this: run it on a bigger grid and you get an accurate simulation of flow patterns. And that means turbulence and swirling eddies and wisps of smoke and things like that:
image:
video:
All we've done is run it on a larger grid (3000x1000) and to show the direction of the local flow with lines. We make the fluid flow from left to right by simply overwriting the left-hand column with particles moving to the right. An obstacle disrupts the flow, shedding eddies in its wake.
The question asks itself: Why does this work? Why does such a simple model of bouncing particles yield a good model of flow? The key is that the particles conserve momentum: they keep moving until they collide, and the particles after a collision have the same total momentum as the particles before the collision. And so over a larger area you get two things happening: a) the fluid will tend to move into areas of lower pressure (particles get bounced out of higher density areas), and b) if an area of fluid has an overall momentum it will get carried forward, pushing against whatever it encounters. It's a delightful system and makes pretty pictures.
Further reading:
- This pattern of vortices behind an obstacle is called a von Karman vortex street. The wikipedia page has some nice photos of real examples, and also tells me that bees use these vortices to fly.
- The C++ source code and executables are available here: http://code.google.com/p/latticegas
- Here we're using a 'pair interaction lattice gas' but there are many others. All things lattice gas are explained here: PDF (2.4MB)
Notes:
- In the particles images, the colour shows which direction they are moving in: grey particles jiggle on the spot, green ones move south-west, turquoise particles move west (sometimes jiggling up and down as they go), etc.
- In the particles images, the top and bottom walls are fixed boundaries - the particles bounce off them. The left and right walls wrap around, so a particle leaving stage right immediately enters stage left. The same thing is true in the bigger grid, except that particles are pumped-in on the left.
- In the eddies video we have subtracted the constant left-to-right flow from each flow vector, to better show the flow patterns. In the eddies image we've subtracted the long-term average flow at each point, which shows the vortices clearly.
- Lattice gases are pretty much obsolete now, there are better models to use if you're a hydrodynamicist. But they're still cute.
This post was originally on LiveJournal.