Sometimes it_s the simplest thing. Turn
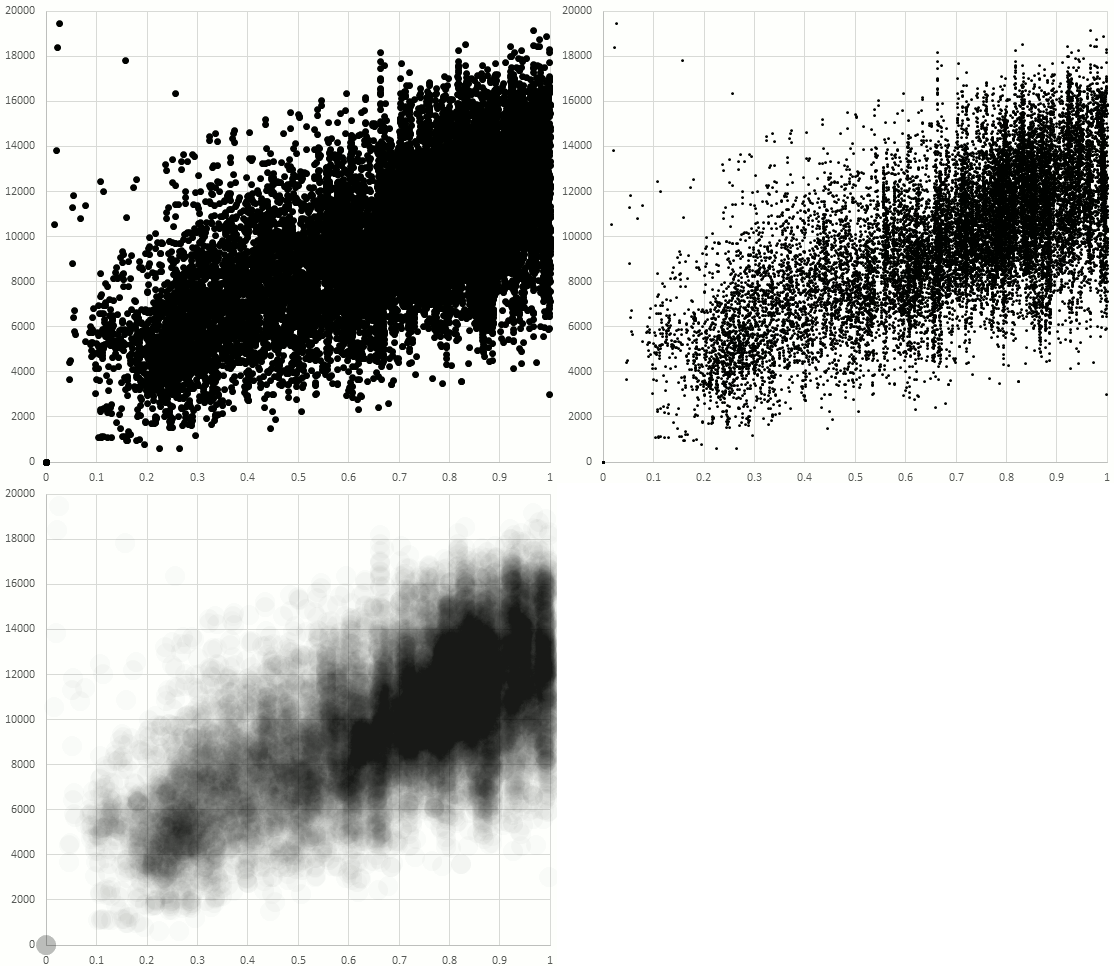
Sometimes it's the simplest thing. Turns out that there's an easy way to make heat maps in spreadsheet software like Excel: use large markers and 98% transparency.
Using tiny dots kind of works too but not when points lie on top of each other.
I work with scatter data all the time, so this is really useful!
The image shows the same scatter with three different markers: default medium dots, tiny dots, and large transparent dots. The true nature of the data is best seen with the large transparent dots.
Now if they'd just support Gaussian markers we'd have kernel density estimation!

Sometimes it's the simplest thing. Turns out that there's an easy way to make heat maps in spreadsheet software like Excel: use large markers and 98% transparency. Using tiny dots kind of works too but not when points lie on top of each other. I work with scatter data all the time, so this is really useful!
Shared with: Public
+1'd by: Kirill Bannov, Gitesh Khodiyar, Paul Gray, Christopher Hanusa, Kevin C., Dave Wonnacott, Ralph H.
Reshared by: Richard Suchenwirth-Bauersachs, Ralph H.
Ralph H. - 2014-01-29 18:22:17+0000
nice idea, thanks!
This post was originally on Google+
